Get that decision wrong and nothing downstream will fix it. ramet5 is the part of our system that makes that decision, and it is the part we have spent the most time on.
Slope, distance to a road, forest type, rainfall: reasonable things to care about. But two things go wrong. Areas that look similar on four variables can be quite different in ways nobody listed. And the person choosing the variables has an interest in the answer. Even with the best intentions, two analysts will choose different variables and get quite different answers, and neither can prove there was no unconscious bias.
The consequence shows up in published work. In one well-known assessment, the comparison areas carrying the most statistical weight for a Colombian project were 900km away in a different ecoregion. Nothing in the method flagged it, because distance and ecoregion were not among the variables being matched on.
In five steps: the satellite record becomes a fingerprint of each patch of land, the project area’s own fingerprint defines what a reference area has to match, the engine searches the surrounding landscape for the closest matches, the project and its references define the training region, and causal inference does the rest.
1. The satellite record becomes a fingerprint
A foundation model is a very large machine-learning model, trained on an enormous quantity of satellite imagery. It learns, without being told what to look for, how to summarise a patch of land as a list of numbers. These lists are called embeddings, because so much information about the patch is embedded in them.
The useful property is that patches which look alike to the model end up with similar numbers. Not similar in one dimension that a person chose, but across everything the imagery contains: forest structure, terrain, water, the marks of roads and clearings and cultivation, how all of it changes through the year.
We describe an embedding as a fingerprint of that patch of land. That is loose, but it is close enough to be useful, and unlike a hand-picked list of variables it does not depend on anyone guessing correctly in advance about what matters.
We work on the A5 geo grid, an equal-area grid built from pentagonal cells. Equal area matters because credits are calculated per hectare, and the commonly used hexagonal grids change area with latitude. The A5 grid is open and we publish our tools for working with it.
The embeddings we currently use come from two published foundation models, AlphaEarth Foundations and Embedded Seamless Data (ESD).
2. The project area sets the specification
This is the step that most distinguishes what we do. We do not start from a list of what a good comparison looks like in general. We start from the project. The project area’s own fingerprint defines what a reference area has to match, so the specification is derived from the similarity of the landscape itself, not from a methodology document or from an analyst’s judgement.
If a project area contains three kinds of terrain and two histories of disturbance, its reference areas have to contain them too, in something like the same proportions.
3. The engine searches the landscape
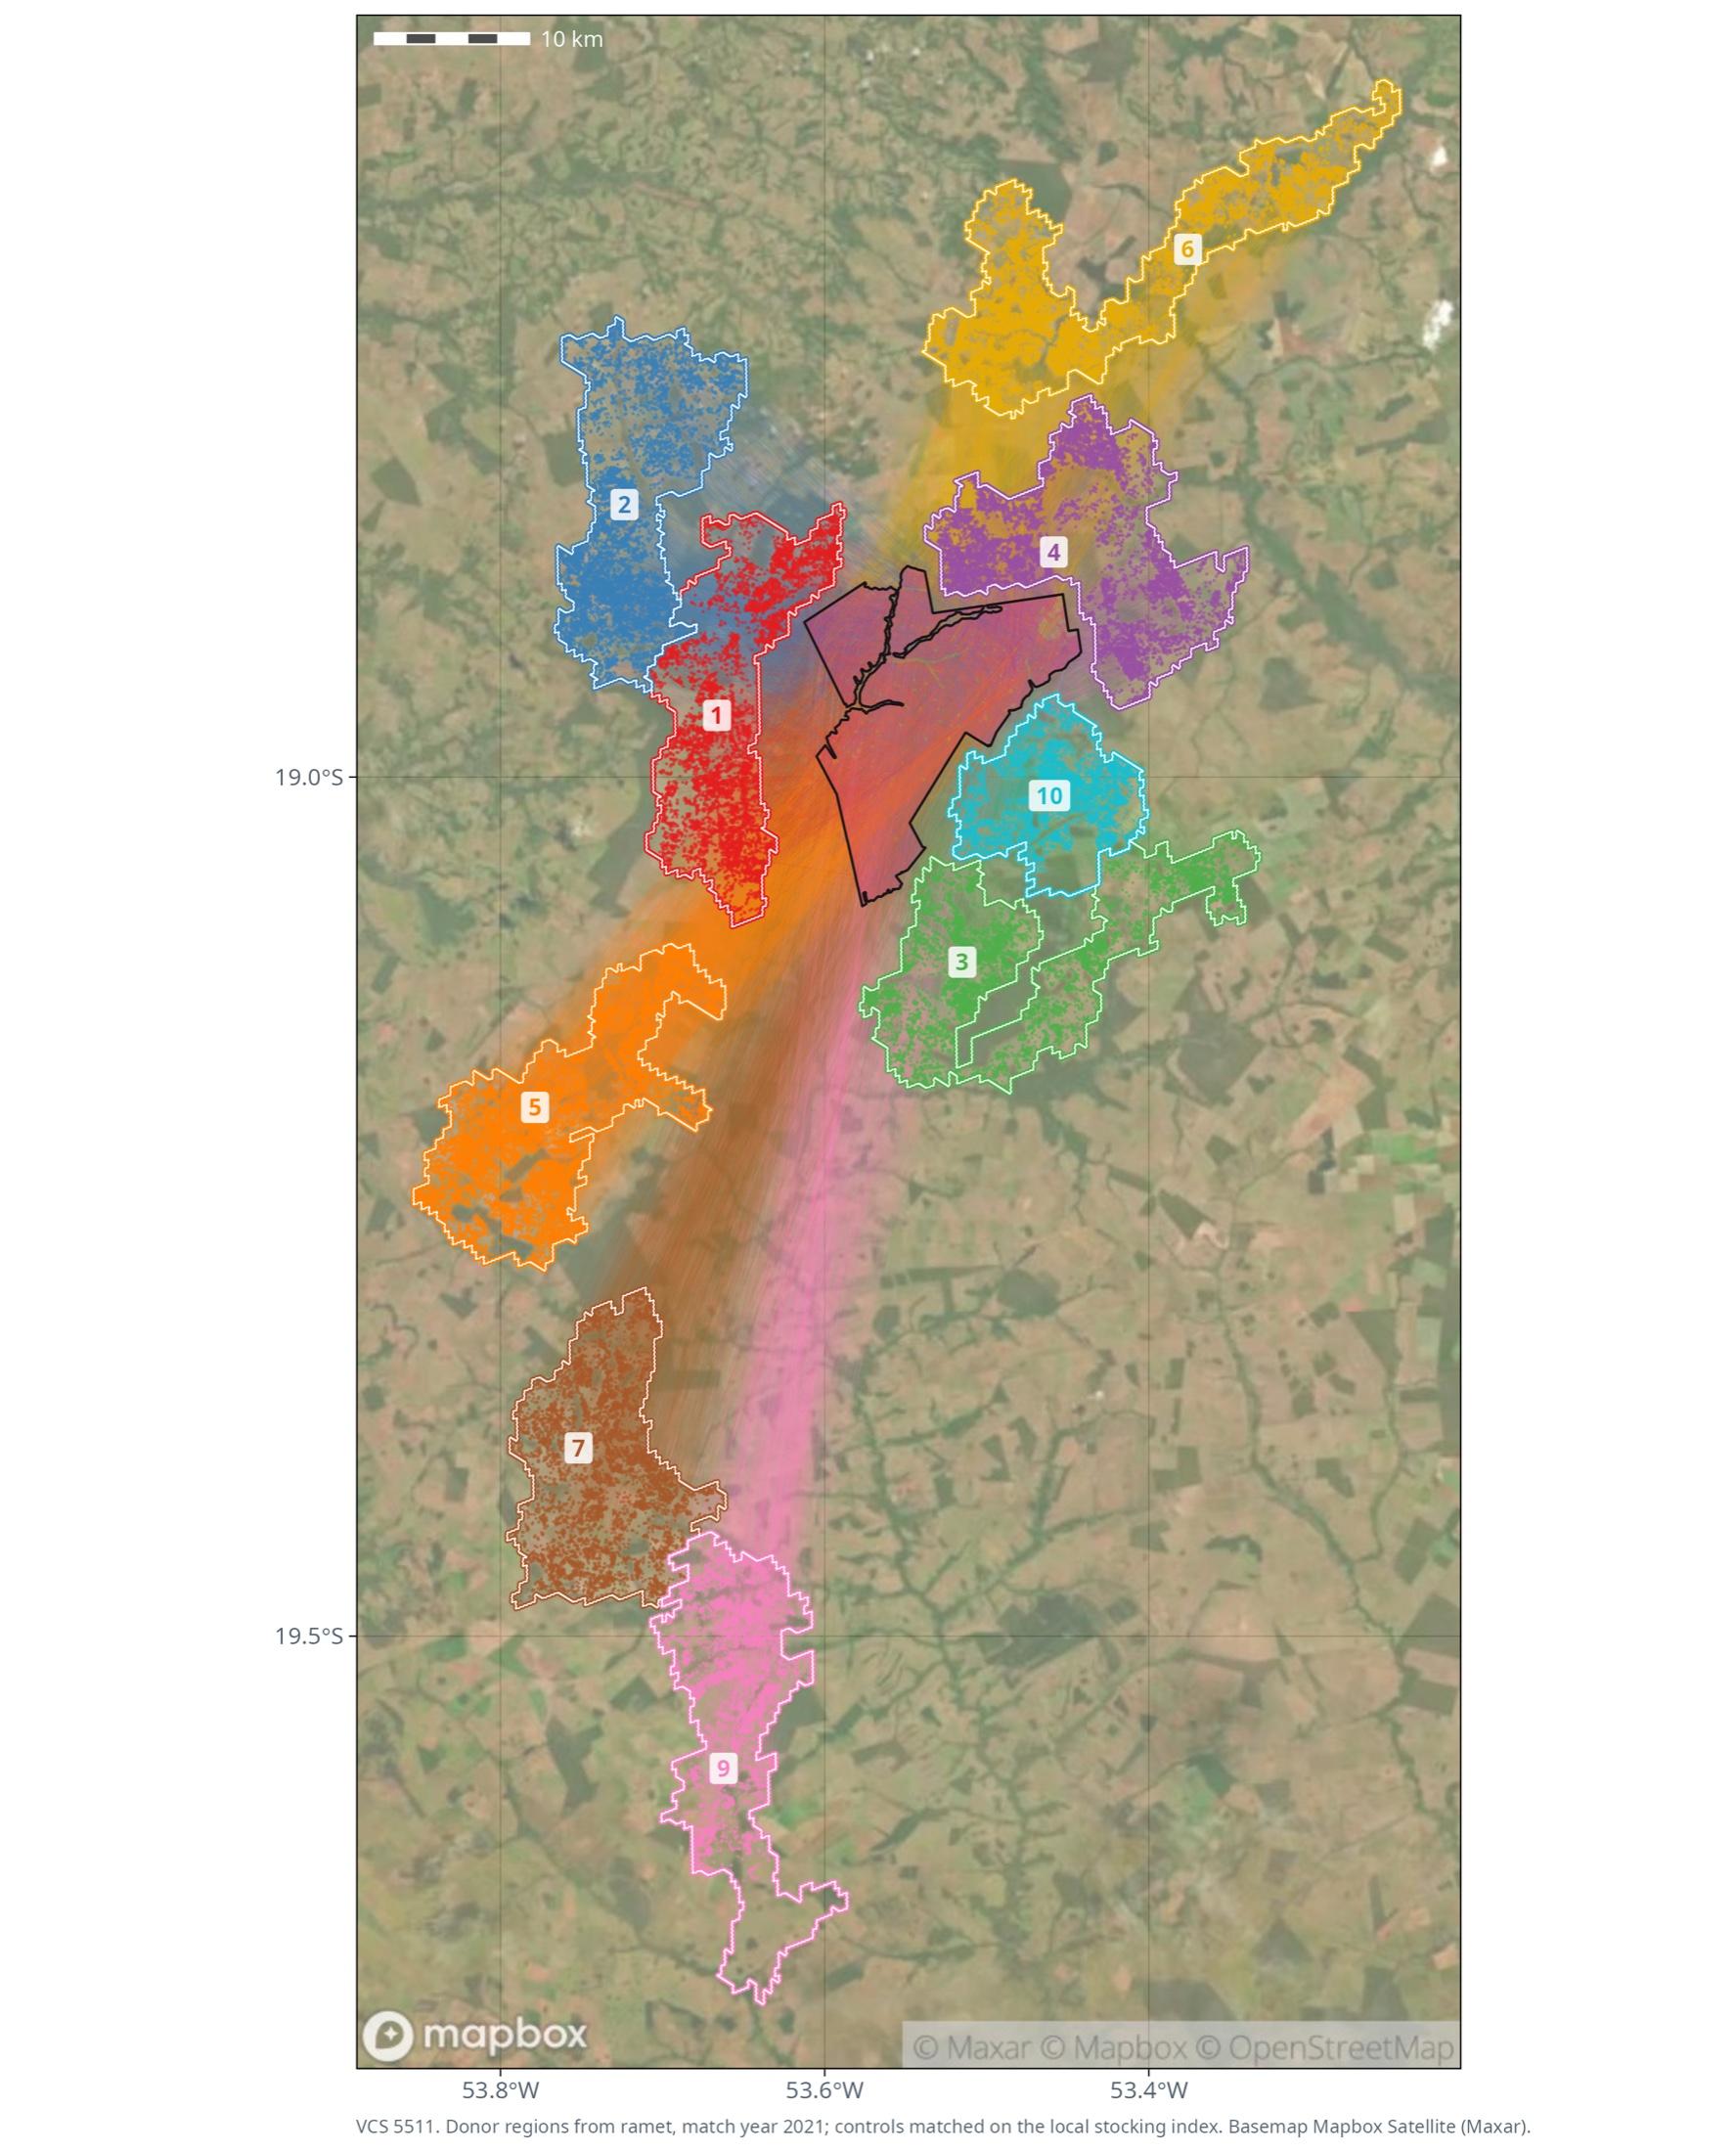
With the specification set, ramet5 searches the surrounding landscape for the areas whose fingerprints come closest to it, and selects them automatically.
The result is reproducible. Run it again on the same project with the same inputs and you get the same reference areas, which is not true of a process involving human selection. It is also fast: days, not weeks, and a jurisdiction that has never been analysed before takes no longer.
4. The project and its references define the training region
The project area and its selected reference areas, taken together, span a region. That region is what we use to train the model that estimates carbon stocking.
A global biomass model is fitted to everywhere at once, so it fits nowhere well. A model trained on the specific region a project sits in, and on the areas it is being compared against, is fitted to the conditions the comparison actually depends on.
That model is trained on canopy structure measured by NASA’s GEDI lidar, validated against other extensive lidar datasets, and checked against two independent biomass products, CTrees and ESA CCI Biomass, over the project and its reference areas.
5. Causal inference does the rest
Once the reference areas exist and the carbon in them can be estimated, the remaining work is statistics with a long history outside this field: matching, synthetic control, difference in differences.
What comes out is an estimate of what would have happened in the project area, with uncertainty attached, not a single number.
For a VM0047 project, in concrete terms, the files are:
- The stocking index as annual maps: the calibrated mean and the lower and upper bound of its prediction interval, one layer per year, as GeoTIFF
- The reference areas as polygons on the A5 grid
- The project and control plots, with their geometry, weights and stocking index series
- The balance, trend and benchmark statistics
- The derivation and validation of the stocking index, as documents
Everything sits on the same fixed global grid, so the project and its reference areas share identical cells. All of it is delivered through our interface, and through an API.
We publish how the method works and we are specific about it, which is unusual in this market and deliberate on our part.
What we do not publish is the implementation: how the model is tuned, and the engineering that makes it run at the speed it does. Those are the parts we have spent years on and they are covered by our patent application. Knowing that a method uses embeddings to select reference areas is a long way from being able to reproduce our results, in the same way that knowing a paper’s methods section is not the same as having its code.
In concrete terms: the stocking index data, its derivation and validation, and every input and output of the matching (plots, geometry, weights, series and statistics) are delivered on request. The code of the matching engine is not published. Where a third party needs to assess it, we work through controlled access plus documentation, sufficient for validation, verification and assurance.
If you are assessing our work and need to go further than this page does, get in touch and we will talk about what we can share and under what terms.
| Market | Product | Status |
|---|---|---|
| Tree planting and restoration, under Verra’s VM0047 | ramet47 | |
| Avoided deforestation | Monitoring available today | |
| Biodiversity and nature finance | Taking pilot projects |
VM0047 is one of the forest methodologies approved under the Integrity Council’s Core Carbon Principles.
The biodiversity case is the same question and a harder one. How many frogs, butterflies or tigers would still be here if the area had not been protected? The logic is identical. The difficulty is that you cannot measure biodiversity from space the way you can measure a canopy. What you can do is choose the most similar habitats as the reference areas, and measure biodiversity on the ground in both the project area and the reference areas.
How we report uncertaintyQuestions people ask
- ramet5 is the matching engine behind every belian.earth product. It decides which other places a carbon project can be compared to, selecting reference areas from the satellite record, not from a hand-picked list of variables.
- A foundation model is a large neural network trained on vast quantities of satellite imagery. It summarises a patch of land as a list of numbers, called an embedding, in which similar-looking places get similar numbers. belian.earth describes it as a fingerprint of that patch of land.
- The project area’s own satellite fingerprint defines what a reference area has to match, so the specification comes from the ground, not from an analyst’s judgement. The engine then searches the surrounding landscape for the closest matches and selects them automatically.
- Yes. Run ramet5 again on the same project with the same inputs and it selects the same reference areas, which is not true of processes involving human selection. A new project takes minutes; a new jurisdiction takes overnight.
- A5 is an equal-area global grid built from pentagonal cells. Equal area matters because credits are calculated per hectare, and commonly used hexagonal grids change area with latitude. The A5 grid is open and belian.earth publishes its tools for working with it.
- belian.earth publishes how the method works and is deliberately specific about it. What it does not publish is the implementation: parameter choices, model tuning and engineering, which are covered by its patent application.
Related reading
Where the belian.earth team has written on the questions this page raises.
VM0047's brave call is your ARR project's defining moment
by belian.earth
VM0047 locks the developer's matched reference areas at validation and keeps them fixed for the full crediting period. That single choice defines your ARR project's baseline for decades.
Read articleOpinionThe carbon baseline problem nobody wants to talk about
by belian.earth
The carbon market has an integrity problem. But while the industry obsesses over which biomass map to trust, the real uncertainty is in the carbon baseline.
Read articlePolicyICVCM
The ICVCM sets the global threshold standard for quality in the voluntary carbon market. Its Core Carbon Principles and CCP label determine which credits are credible, which methodologies are sound, and where the market needs to go further: REDD+, reforestation, permanence, leakage, and buffer pools.
Read moreStay in the loop
Stay up to date with developments in independent reference area selection and carbon market baselining.