That change put a great deal of weight on one decision, and it is the decision we handle. This page explains how a VM0047 baseline is built, what the methodology asks for at each step, and what belian.earth supplies.
ARR covers projects that put trees back: planting them, restoring degraded land, or protecting a site so that it regrows on its own. A credit represents carbon the trees took out of the atmosphere that would not otherwise have been taken out. So the whole claim depends on knowing what the land would have done without the project.
VM0047 replaced the projection with a comparison. Instead of assuming what the land would have done, the methodology looks at comparable land that did not get a project, and uses what happened there. That is what makes the baseline dynamic: it moves with observed conditions through the life of the project.
A projection cannot be checked. A comparison can, because the places are real and anyone can look at them. The methodology documents are published on Verra’s VM0047 page.
Under the Paris Agreement’s Article 6.4 mechanism the equivalent planting methodologies are still being written; we follow them on our A/R PACM methodologies page.
VM0047 has two ways of quantifying removals. The area-based approach measures change across the whole project area from satellite data and field plots, and sets its baseline from matched control plots. The census-based approach counts the planted trees themselves and does not use control plots; it suits dispersed planting such as agroforestry, shelterbelts and urban trees. A project may use one, the other or a combination, depending on which applicability conditions it meets. This page is about the area-based approach, the one that needs reference areas.
The mechanism at the centre of VM0047 is the performance benchmark. In plain English, it is the bar the project has to clear, and it is set by what happens on comparable land, not by a number agreed in advance.
It works in three steps. First, at validation, the project is matched to a set of comparable areas, known in the methodology as control plots. Second, those areas are watched for as long as the project runs. Third, at each verification the benchmark is recalculated from what has grown in them since the last check.
The project is credited only for the difference. If the comparable land regrew a certain amount on its own, the project gets no credit for matching it, and credit only for what it achieved beyond it. This is the core of the design, and it is why the methodology needs comparison areas at all. Land that is left alone does not stay bare. Some of it regrows without anyone planting anything, and a project that took credit for that regrowth would be selling something it did not cause.
A useful consequence is that a good year for the whole region is not automatically a good year for the project’s credit count. If the rains were kind and everything grew, the comparison areas grew too, the benchmark rises with them, and the project is measured against the better conditions everyone had. A baseline projected forward from history would have missed that entirely.
One part of the arrangement does not move. The benchmark is recalculated, but the comparison areas it is calculated from are not reopened. They are chosen once and kept.
A stocking index is the historical measure of how much was growing on a site before the project began. It is built from the satellite record, not from a survey, which is what makes it possible to calculate the same measure consistently across a project area and across every area it is being compared to.
Under VM0047 it does two jobs. They fail in different ways.
It decides what is eligible. Land that already carried substantial tree cover before the project is not land where a project can claim to have added trees. The stocking index is how that line gets drawn, which means it determines which parts of a site can be included at all.
It is the measuring stick. The same index is calculated for the comparison areas, and VM0047’s prescribed matching procedure selects the closest controls on it. The benchmark is then recomputed from stocking index data in those areas at each verification.
Because it does both jobs, an error in the stocking index does not stay in one place. It moves the eligibility line and it moves the bar the project is measured against, and it does so for every issuance the project ever makes.
There is a limit. Matching on the index alone compares places on how much is growing, not on what kind of place they are. As we have written elsewhere, two areas can look identical on a stocking index while sitting in completely different landscapes: a back garden surrounded by houses can match a forest patch on greenness alone. That is why the pool of candidate areas the matching runs within matters as much as the matching itself.
Our stocking index measures canopy structure, with NASA’s GEDI lidar as the reference: canopy height and plant area index, a measure of canopy density, used together. It is built from two published satellite embedding products, Embedded Seamless Data (Chen et al., 2026; Landsat and MODIS, consistent from 2000) and AlphaEarth Foundations (Brown et al., 2025; from 2017), with a model trained for the project’s region against GEDI canopy measurements. It is produced for every year of the baseline and monitoring period, with no gap years.
Every value carries a prediction interval, checked against GEDI data held back from training; on held-out data, 95% intervals cover about 95% of observations. Accuracy is reported against GEDI held out geographically, so the check area is never seen in training: for canopy height, about 72% of the variation explained and a typical error of about 2.5 m. We supply the index only where we can show it tracks biomass in the project’s forest type, cross-checked against independent biomass products and local field plots where they exist.
The reference areas are fixed at validation and do not change afterwards. The control plots, their weights and their coordinates are set once and held for the duration of the crediting period, which for most ARR projects under the VCS Standard runs 20 to 40 years.
Verra chose that deliberately, and it was right to. A baseline that let a developer quietly upgrade its comparators whenever the numbers looked unflattering would not be a baseline at all. But it does mean there is no second chance. Everything the project is credited on for the rest of its life is measured against a comparison chosen before anyone knew how it would turn out, and the first anyone usually hears about a poor choice is when an auditor or a buyer asks a question that cannot be answered.
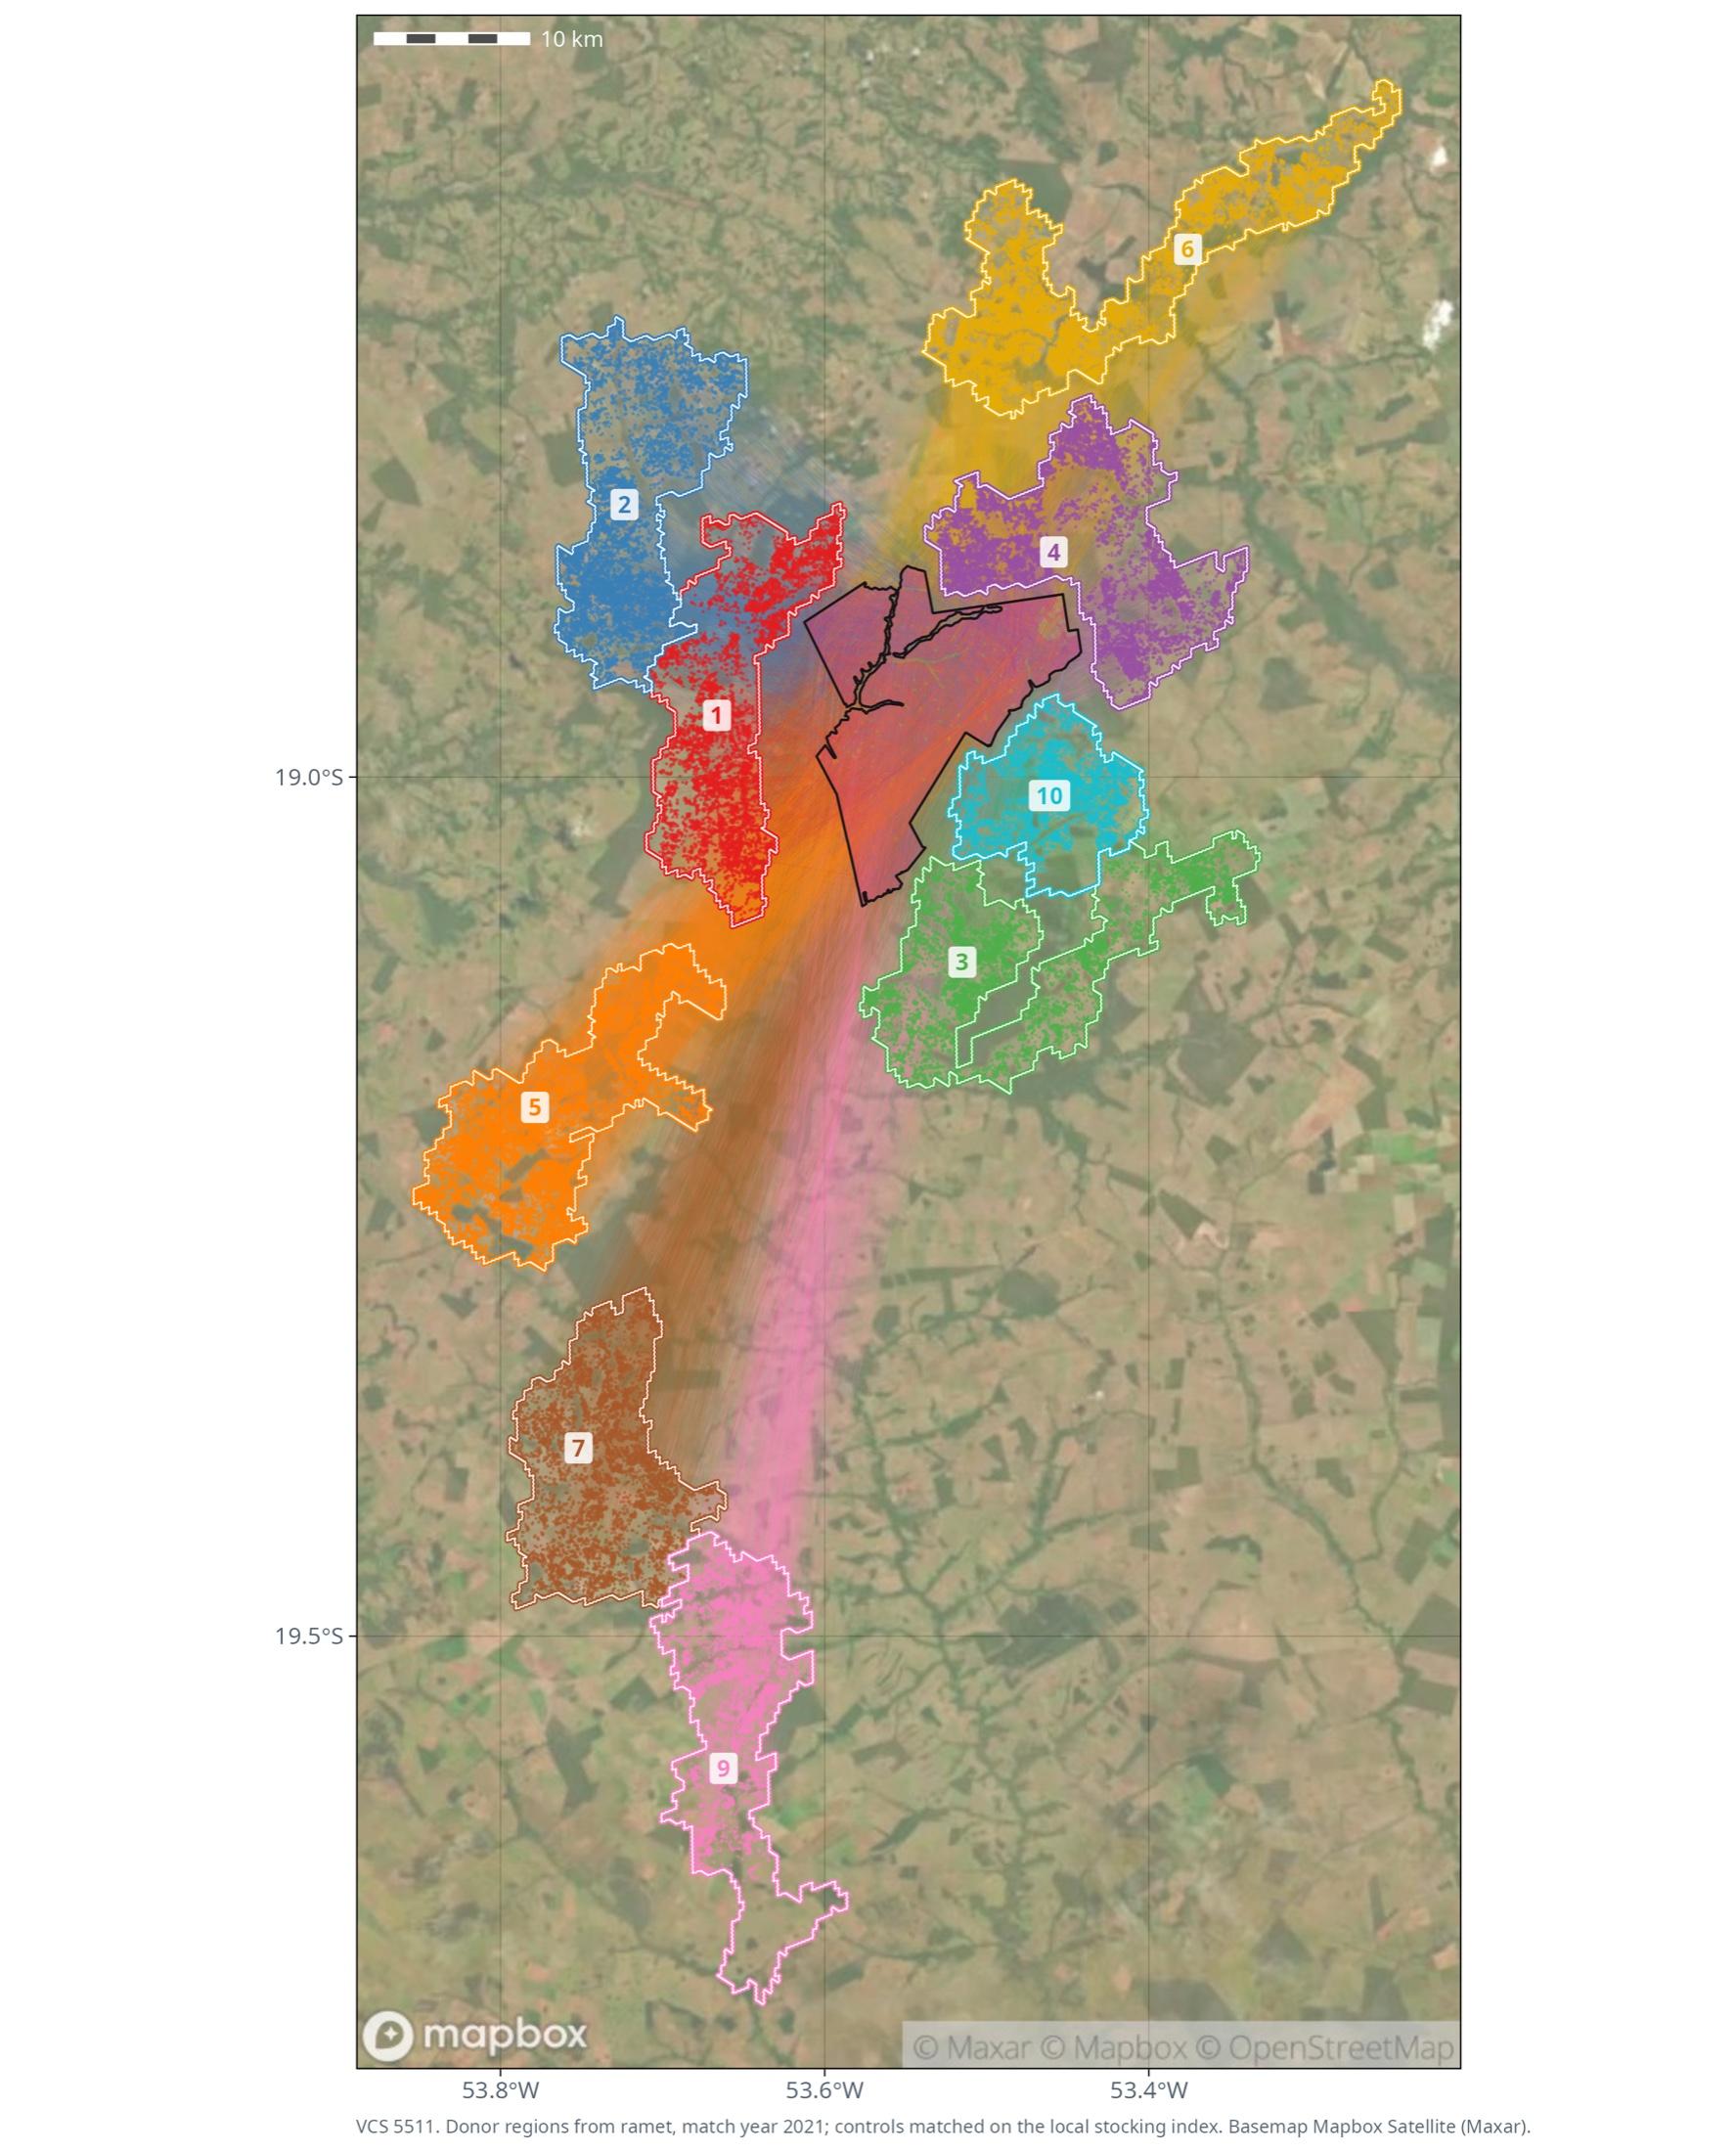
The pool of candidate control land starts as VM0047’s own eligibility rules, set out in the methodology’s Table A1: same jurisdiction and ecoregion, matched policy and tenure, within 100 km, with the project, protected areas and registered carbon projects removed. Within that pool, we narrow the candidates to land that resembles the project, using the fingerprint of the landscape, a step the methodology permits under Appendix 1, Section A1.4 Step 2.1. It only ever narrows the pool; it never admits land the rules exclude, and it is reported as an explicit, auditable step. The second extension we flag is the matching variable itself: a stocking index trained for the project’s region, in place of a coarse global product.
VM0047 asks for uncertainty to be quantified. We treat that as the starting point, not an extra, because a baseline is an estimate of something that did not happen, and the way to report an estimate is with the range around it.
A planting project can measure what grows to the millimetre, but not how much would have grown back on its own. The uncertainty in an ARR baseline does not come from one place. It comes from the matching, from the inputs the stocking index is built on, and from the selection of the comparison areas themselves. We report a range around every estimate that covers all three, not a single figure that hides which part of the work is least certain.
Reporting a range is not the same as rating a project. We publish the estimate and the bounds around it and leave the judgement to buyers, auditors and standards bodies. More on why we report a range.
For the stocking index, the range around each value covers the model’s error combined with the error of the GEDI lidar it is checked against, so it is conservative for the true state of the canopy. It is validated to its stated coverage on data held back from training. Field plots, where they exist, calibrate the index to ground-measured biomass and tighten that range.
VM0047 runs on geospatial analysis. Somebody has to build the stocking index, find the comparison areas, run the matching and produce the numbers a project is validated and verified against. Verra’s Data Service Provider arrangement is the route by which that analysis is supplied to projects and to the auditors checking them.
For a developer, the practical point is who stands behind the analysis. If the developer produces the analysis, auditors and buyers will ask whether it was steered. Independent analysis with a reproducible method removes the question.
Verra’s methodology documents are available at verra.org.
What a developer gets is a baseline they did not choose and can therefore defend: the comparison areas selected by a process that runs the same way every time, the maps behind them, and a record an auditor can follow. Because the selection is automated, the work arrives in days, not the weeks of analyst time it takes to assemble by hand.
Our product for VM0047 is called ramet47. It runs on ramet5, the matching engine underneath everything we build.
Reference area selection. Comparable areas chosen from the satellite record, not from a shortlist of variables, with the selection derived from what the project area contains. Reproducible, so running it again gives the same answer.
Stocking index mapping. Historical stocking across the project and its reference areas, from a model trained on that region, not a global product.
The dynamic baseline and performance benchmark. Updated through the crediting period from the reference areas, as the methodology requires.
Uncertainty. Reported as a range around every estimate, covering the matching, the inputs and the selection. VM0047 asks for uncertainty to be quantified.
Audit materials. A pack written for someone examining it critically, not a summary. If our outputs generate findings during validation or verification, we answer them in writing until they are closed.
- The reference areas. maps and coordinates of every selected area, with the reasoning for each selection; the eligible area and the narrowed candidate pool as maps, with what was searched, what was excluded, and why.
- The stocking index. annual maps of the calibrated index with its lower and upper bands, for the project and its reference areas, as GeoTIFF; its derivation and validation evidence (accuracy against held-out GEDI lidar, cross-checks against CTrees and ESA CCI Biomass, local field plots where available); and the data sources, product versions and weights used for each year.
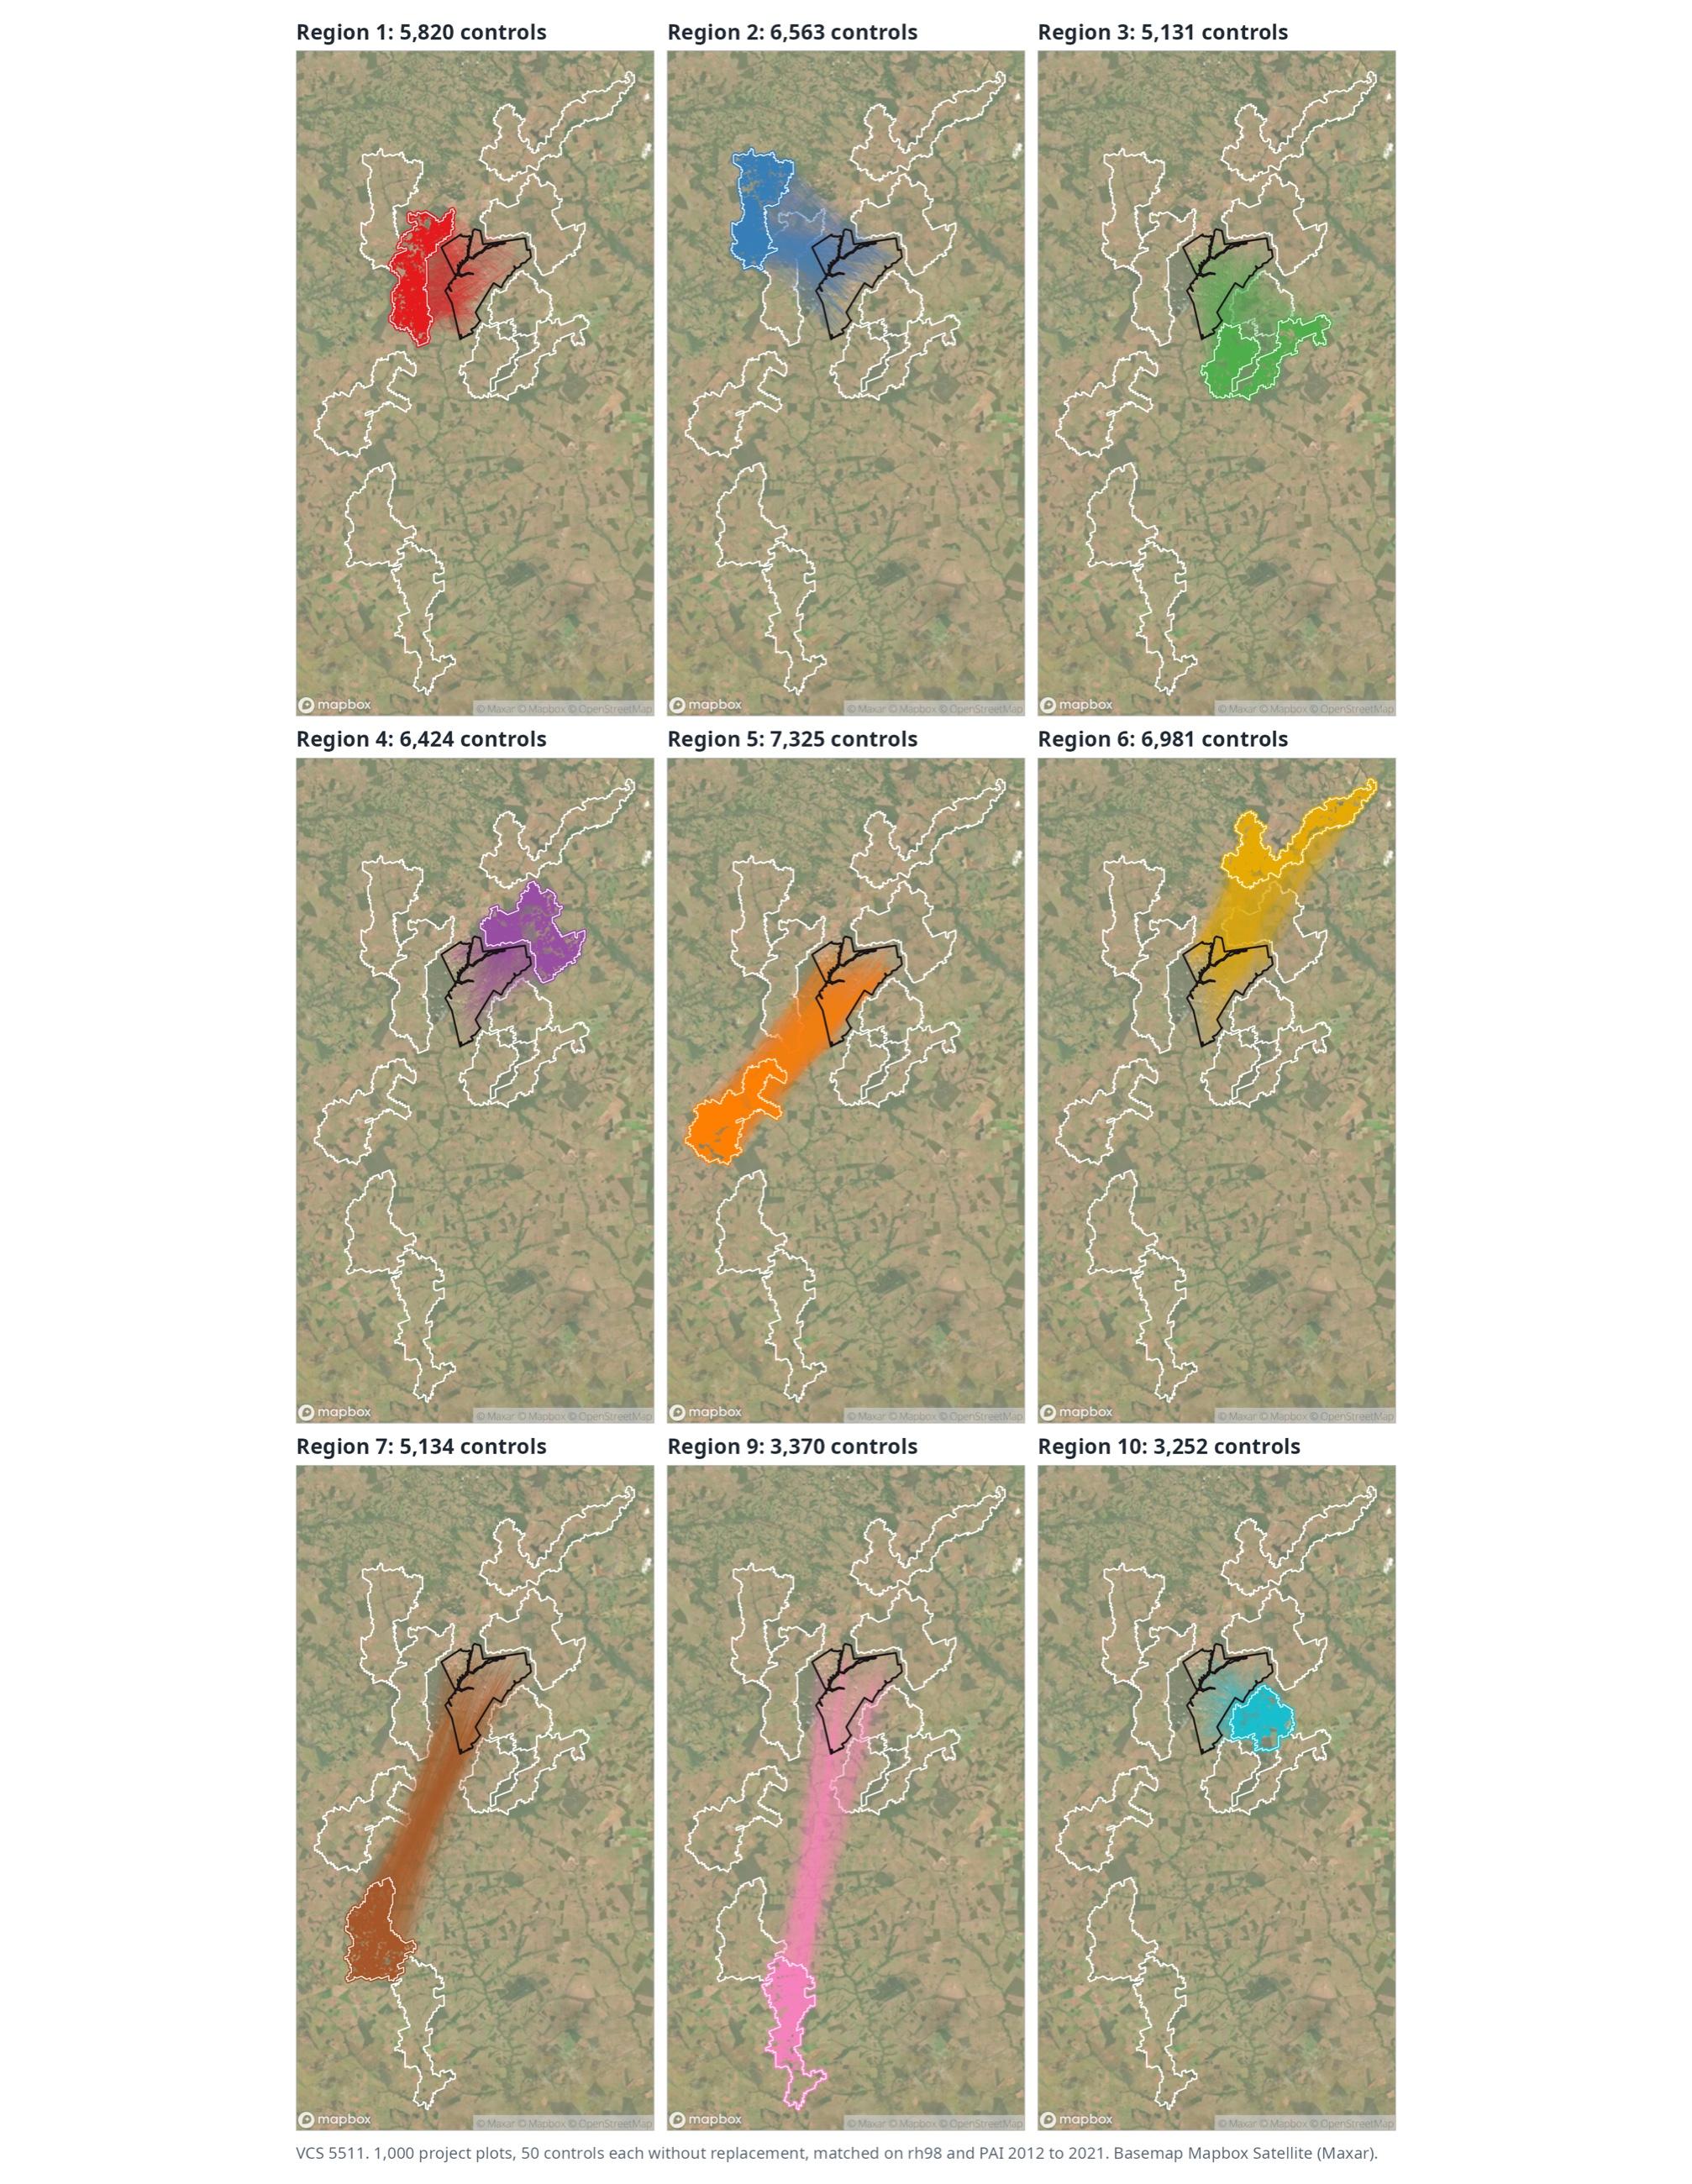
- The matching record. the methodology’s prescribed procedure, run as written; the project and control plots with their geometry, weights and stocking index series, on a fixed global grid for the crediting period; and balance statistics for every matching variable.
- The baseline and benchmark. the estimate with its upper and lower bounds, the trend and benchmark statistics, and how they are re-evaluated at each verification.
- The reproducibility statement. what an auditor needs in order to run the selection again and get the same answer, plus the methodological logic and the steps run, on request by the project proponent, Verra or the validation and verification body.
We price per project. Reference areas are always included, however many the analysis needs, because the reference areas are the product. Larger projects cost more than smaller ones.
There is no setup fee, and we quote the current year’s price without asking anyone to commit to a multi-year arrangement.
Not every run is for an audit. If you are still choosing a provider, checking reference areas selected in house, deciding whether a site can go ahead, or putting a project in front of funders, we run the same analysis at a lower price than an audit year. The answer is the same; what you are not paying for is the audit materials and the work at each verification. Ask us for the preview price.
Knowing early whether a site can go ahead is cheaper than finding out at validation.
Ask every provider the same six questions, us included: can the selection be rerun, what was searched and what was excluded, how much was chosen by hand, how similar the selected areas actually are to the project, what the auditor will see, and who answers findings. What we hand over is listed under What belian.earth delivers for VM0047.
Whether you chose your reference areas yourself or someone else did, we can tell you what our method would have selected and where the two differ. Some clients find that reassuring and some find it useful to know early.
Ask for a second opinionIf you want to know whether a site will support a defensible baseline before committing to it, that is a smaller piece of work than a full validation package and we do it separately.
Ask about a feasibility checkQuestions people ask
- VM0047 is Verra’s methodology for projects that plant, restore or regenerate trees, known as ARR (afforestation, reforestation and revegetation). It sets baselines by comparison with matched reference areas, not by projecting past trends forward.
- Baselines built by projecting a site’s own past forward. That approach assumed the land would carry on as it had been going, which could not be checked against anything, and a more pessimistic assumption produced more credits. VM0047 replaced the projection with comparison against real places.
- The performance benchmark is what the project is measured against, calculated from what is observed in the matched reference areas. It is recalculated at each verification using new stocking index data from those areas, so the benchmark moves with observed conditions. The project earns credit only for growth beyond it.
- At validation. The performance benchmark updates through the crediting period using what is observed in the reference areas, but the areas themselves do not change afterwards. A project carries its choice of reference areas for the life of the project.
- For most ARR projects under the VCS Standard the crediting period runs for 20 to 40 years. The reference areas chosen at validation define the project’s performance benchmark for that whole time.
- A stocking index is the historical measure of how much was growing on a site before the project began. Under VM0047 it does two jobs: it decides which land is eligible, and it sets what the project is measured against.
- Data Service Providers supply the geospatial analysis that projects and auditors rely on under the methodology: the stocking index, the comparison areas, the matching and the numbers a project is validated and verified against.
- ramet47 is belian.earth’s product for VM0047. It runs on ramet5, the matching engine, and delivers reference area selection, stocking index mapping, the dynamic baseline and performance benchmark, uncertainty reporting, and audit materials.
- Per project, not per hectare of reference area. Reference areas are always included, however many the analysis needs. There is no setup fee, and belian.earth quotes the current year’s price without asking for multi-year commitments.
- Not from measuring what grows, which can be done to the millimetre. It comes from estimating how much would have grown back on its own, which is the question the reference areas and the performance benchmark exist to answer.
Related reading
Where the belian.earth team has written on the questions this page raises.
VM0047's brave call is your ARR project's defining moment
by belian.earth
VM0047 locks the developer's matched reference areas at validation and keeps them fixed for the full crediting period. That single choice defines your ARR project's baseline for decades.
Read articleResearchWhy Forest Restoration Projects Need Robust Counterfactual Baselines
by Christopher D. Philipson
Every forest carbon project depends on a counterfactual baseline to demonstrate its impact. Whether avoiding deforestation or restoring degraded land, the underlying question is the same: what would have happened without the intervention?
Read articleOpinionThe carbon baseline problem nobody wants to talk about
by belian.earth
The carbon market has an integrity problem. But while the industry obsesses over which biomass map to trust, the real uncertainty is in the carbon baseline.
Read articleUnfamiliar with a term? See the glossary.
Stay in the loop
Stay up to date with developments in independent reference area selection and carbon market baselining.